|
Click here to see the full interview directly on YouTube. Audio-only streams are also accessible via Blockworks, Spotify, and Apple Podcasts. The world’s fastest-growing major economy, India is being turbocharged by its: exceptionally favorable demographics; accelerating urbanization; recent formation of a nationwide free-trade area; transformative ongoing upgrades of infrastructure – both physical and digital; and increasing attractiveness as a manufacturing and export hub. This unrivaled combination of complementary macroeconomic tailwinds is set to define our era as the Indian Century. 
Skyscrapers under construction in Mumbai.
Since I first traveled to India over a decade ago, the country has unleashed dramatic economic reforms, launched countless ambitious infrastructure projects, lifted hundreds of millions of its citizens out of poverty, quintupled the share of its population with access to the internet, and attracted a growing share of global supply chains for everything from pharmaceuticals to iPhones. Optimism is pervasive from boardrooms to street markets as Indians take pride in their country’s status as the most dynamic pillar of the global economy.
The fastest-growing major economy
India is the world’s fastest-growing major economy, and is expected to retain that distinction for many years to come.
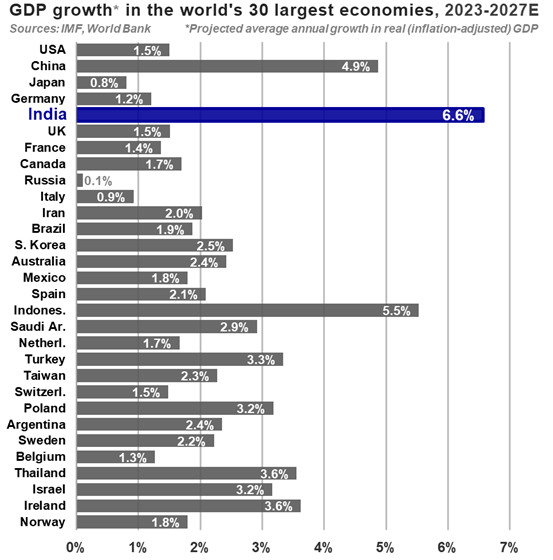
Over the past decade, India surpassed Canada, Brazil, Italy, Russia, France, and the U.K. to become, as of 2023, the world’s fifth-biggest economy measured at market exchange rates. By 2027, per IMF projections, India will have eclipsed Germany and Japan to become the third-largest economy (after the U.S. and China), with a GDP exceeding $5 trillion at market exchange rates. When measured using purchasing power parity (a method of equalizing the purchasing power of different currencies; see appendix for detailed definition), India already boasts the globe’s third-largest economy – and, per OECD projections, is on track to eclipse U.S. GDP within a generation. 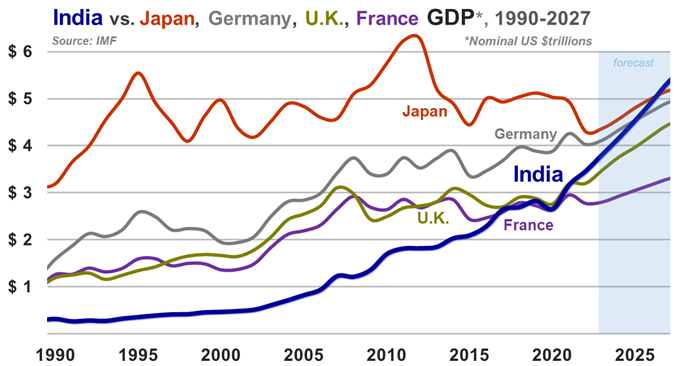
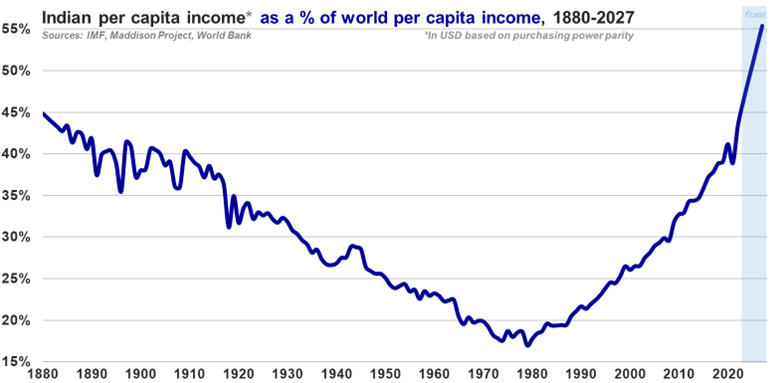
Despite having one of the highest rates of population growth among the world’s 30 largest economies, India’s GDP is also the fastest-growing out of that group on a per-capita basis. Growth in India’s per capita income (i.e., GDP divided by population) has long outpaced that of the world as a whole – and the differential is only expected to widen in the years ahead. 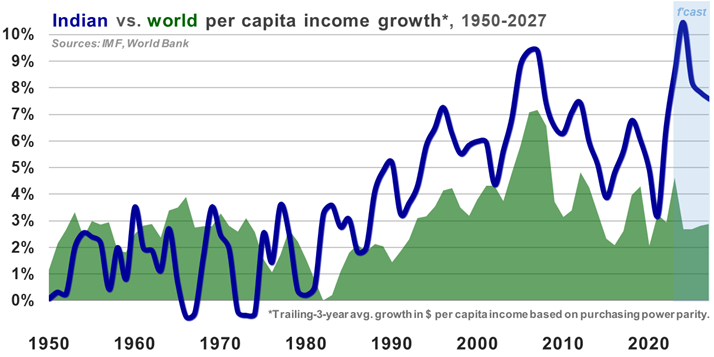
Exceptionally favorable demographicsWith a median age of just 28, India has the most youthful demographics among the world’s leading economies. The number of school-age Indians (defined as people aged 5 to 18) exceeds the United States’ entire population. As of this writing, India has either already surpassed China as the world’s most populous country, or is on the verge of doing so. Between now and the 2060s, India’s population (currently 1.4 billion) is projected to increase by another quarter of a billion people – roughly mirroring the number by which China’s population is forecast to decline over that same period. Today’s population growth is the result of India’s past high birthrates. India’s total fertility rate (defined as the average number of children born to a woman over her lifetime) has dropped by two-thirds, from approximately 6 in the 1960s to, as of 2020, below the replacement level of 2.1. Despite this recent drop below replacement fertility, India’s overall population continues to grow because previous decades’ higher birthrates have resulted in a “youth bulge” – a generation larger than those immediately before and after it – that is now entering childbearing (and working) age. 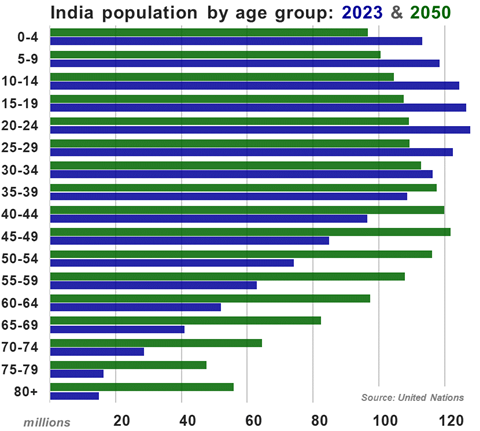
As the members of this boom generation continue to enter the labor force, India’s working-age population (defined by demographers as people aged 15 to 64) is set to continue growing both in terms of absolute numbers and as a share of the overall population. Thanks to India’s youthful demographics, the working-age share of its population (currently approximately two-thirds) should continue inching up into the 2030s before stabilizing (at just below 70%) through the middle of this century. The ongoing expansion in the working-age share of India’s population – a phenomenon known as a “demographic dividend” – means India’s youth are entering the prime of their working lives with relatively few dependents to support, allowing an increasing share of national income to be re-invested into infrastructure, education, and other productivity-enhancing public goods (as opposed to, say, old-age pensions). 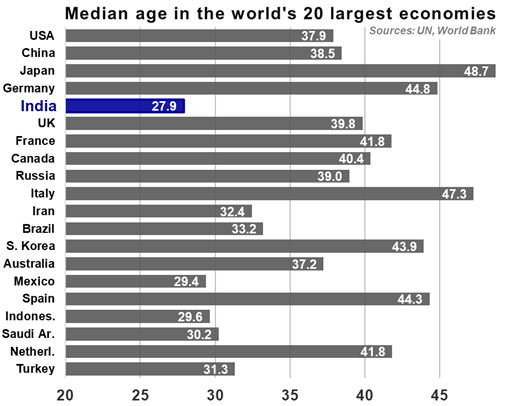
By contrast, workforces are already in decline both in absolute and percentage-of-population terms in most high-income economies, as well as in China. The combined labor forces of high-income countries and China are projected to shrink by more than 200 million people between now and the 2040s. As detailed in the Demographics dispatch, unfavorable demographics in general – and shrinking, aging populations in particular – exert strong negative effects on variables ranging from growth in productivity and GDP to rates of savings and investment. While other major economies’ dwindling, greying workforces will increasingly struggle to support ballooning numbers of retired dependents, India is poised to add roughly another 160 million people to its labor force between now and midcentury. 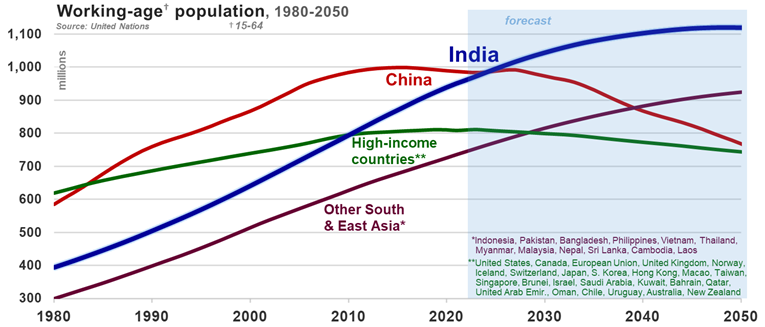
Accelerating urbanizationToday, 65% of Indians still live in rural areas – making the country roughly as urbanized as China in 2000, South Korea in 1967, Japan in 1935, Europe in 1915, or America in 1890. 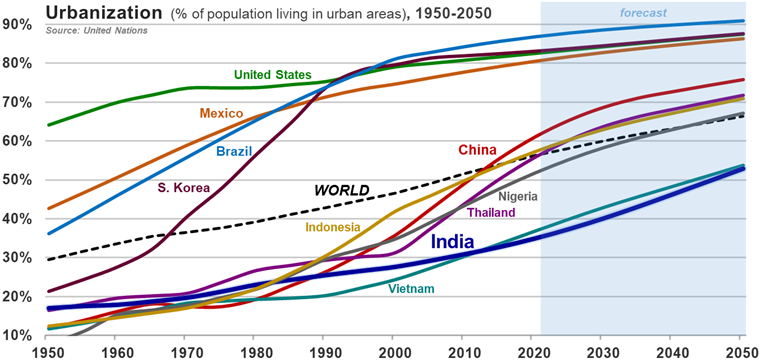
India’s exceptionally favorable demographics are being complemented by the country’s ongoing urbanization. India’s urban areas are gaining a New York City’s worth of new residents roughly every nine months – marking acceleration just in the short span of time since the 2017 publication of the Demographics dispatch (when India was adding an NYC’s worth of new city-dwellers merely every ten months). India’s rural-to-urban migration is nevertheless in its early days, with roughly 65% of the population still living in rural areas. 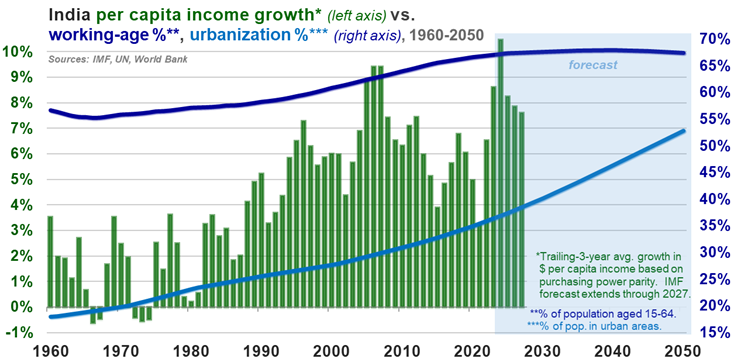
As laid out in that earlier dispatch, an expanding labor force, rising ratio of working-age people to dependents, accelerating urbanization, and remarkably competitive labor costs bolster India’s economy in interrelated and synergistic ways. For example, India’s urbanization speeds its progression toward lower birthrates, while its expanding, increasingly productive cities reinforce the economic incentives driving rural-to-urban migration, even as the villagers continuing to migrate into India’s urban workforce sustain the country’s extraordinarily competitive labor costs. The combination of these simultaneous and complementary macroeconomic advantages is unique among the world’s major economies, and will continue to serve as an extraordinary tailwind to India’s economic growth for decades to come. Unified national market
Until a few years ago, trucks carrying goods the 1,900 kilometer (≈ 1,180 mile) distance between Mumbai (on the Arabian Sea on the west coast of India) and Kolkata (in the north-east on the Bay of Bengal) were forced to stop two dozen times to pay inter-state customs duties and verify paperwork. Businesses operating across state lines had to comply with separate value-added tax regimes administered by each of India’s more than thirty federal subdivisions, along with a hodge-podge of centrally- and locally-administered excise duties, sales levies, and entry fees that resulted in a multi-layered cascade of indirect taxes at every stage from production to distribution.
Rather than attempt to abide by the byzantine rules, some companies with pan-India operations simply opted to maintain separate factories and warehouses in every state they served. Meanwhile, publicly-traded companies found themselves fending off price undercutting from smaller-scale establishments whose competitive advantage consisted of their ability to evade taxes and ignore health and safety regulations. In July 2017, this jumble of fragmented tax laws was jettisoned in favor of a single, nation-wide Goods and Services Tax (GST) – the most significant overhaul of India’s tax system since independence in 1947. Hailed by Indian Prime Minister Narendra Modi as a “good and simple tax,” GST is boosting the number of taxpayers by streamlining and incentivizing compliance. Each time a business collects GST on a sale, that firm becomes eligible for a credit representing the tax already collected at the previous stage of the supply chain. A reform comparable in significance to the postwar formation of the European single market, GST has finally given Indian businesses access to an integrated, nationwide free-trade area, making it much easier to create efficient supply chains and build economies of scale. Importantly, such credits can only be availed on inputs sourced from suppliers who are themselves GST-compliant – creating a built-in deterrent against tax evasion, and thereby levelling the playing field for law-abiding companies. Like so much else in India (see "Digital India" section below), the entire system is facilitated in real-time by sophisticated, homegrown technology – in this case, a central IT platform known as the Goods and Services Tax Network (GSTN). Over the past five years, the number of businesses collecting GST has more than doubled, to nearly 14 million, while the nominal amount collected has almost tripled, to roughly ₹18 trillion (≈$220 billion). Spikes in social security registrations and online job postings point to a long-awaited upsurge in formal employment. Financial inclusion is being bolstered by small- and medium-size enterprises’ ability to use their electronic GST payment records as documentation for obtaining credit. Perhaps most importantly, travel times for long-haul trucks carrying goods between India’s states have been reduced by more than 20% – a metric that can be expected to improve even further as India dramatically ups its investment in highways and other infrastructure. Infrastructure upgradeSpotty or non-existent infrastructure has long held India back. In response, India’s government has committed to what The Economist recently called “an eye-wateringly big […] infrastructural makeover on a scale unprecedented outside China.” India will spend 1.7% of GDP on transport infrastructure this year – up nearly threefold from 2020, and around twice the level in the U.S. and most European countries. This infrastructure upgrade will reduce businesses’ logistics costs, attract more private-sector investment, and boost economic activity. Virtually every major Indian city is awash in a multitude of large infrastructure projects. The number of Indian airports with scheduled airline service has doubled over the past eight years (to 148), while domestic air passengers swelled from 60 million in 2013 to a post-pandemic peak of 123 million in 2022, making India the world’s third-largest aviation market after China and the United States. In anticipation of a projected surge in passenger traffic to 400 million before the end of the current decade, newly-privatized Air India (India’s second-largest domestic carrier, after IndiGo) recently agreed to purchase 470 Airbus and Boeing jets – representing one of the largest aircraft orders in global aviation history. Other infrastructure, from roads to railways, is also being built a record pace. The roughly 80,000 kilometers (≈ 50,000 miles) of roadway added to India’s national highway network over the past 15 years exceeds the aggregate length of America’s entire Interstate Highway System. New and expanded metro rail lines currently under construction in 27 cities add up to 980 kilometers (≈ 610 miles) – exceeding the 810 kilometers (≈ 500 miles) of metro lines already operational across 20 Indian cities. This frenzy of infrastructure development has temporarily worsened Indian cities’ already-harrowing traffic – but, as the CEO of a Chennai-based auto parts company recently told me, “inconvenience now is the price we pay for the future benefit.” Ten indigenously-designed, Indian-built Vande Bharat intercity express trains have entered service since 2019, with hundreds more in the works. Construction has begun on India’s first truly high-speed rail line, which will use Japanese-developed Shinkansen trainsets to zip passengers between Mumbai and Ahmedabad at speeds faster than Amtrak’s Acela service. Two new “freight corridors” between Mumbai and Delhi and between Punjab and West Bengal will allow goods to be moved on double-stacked trains along electrified tracks at speeds nearly triple today’s 25 kilometer/hr. (≈ 16 mph) average. 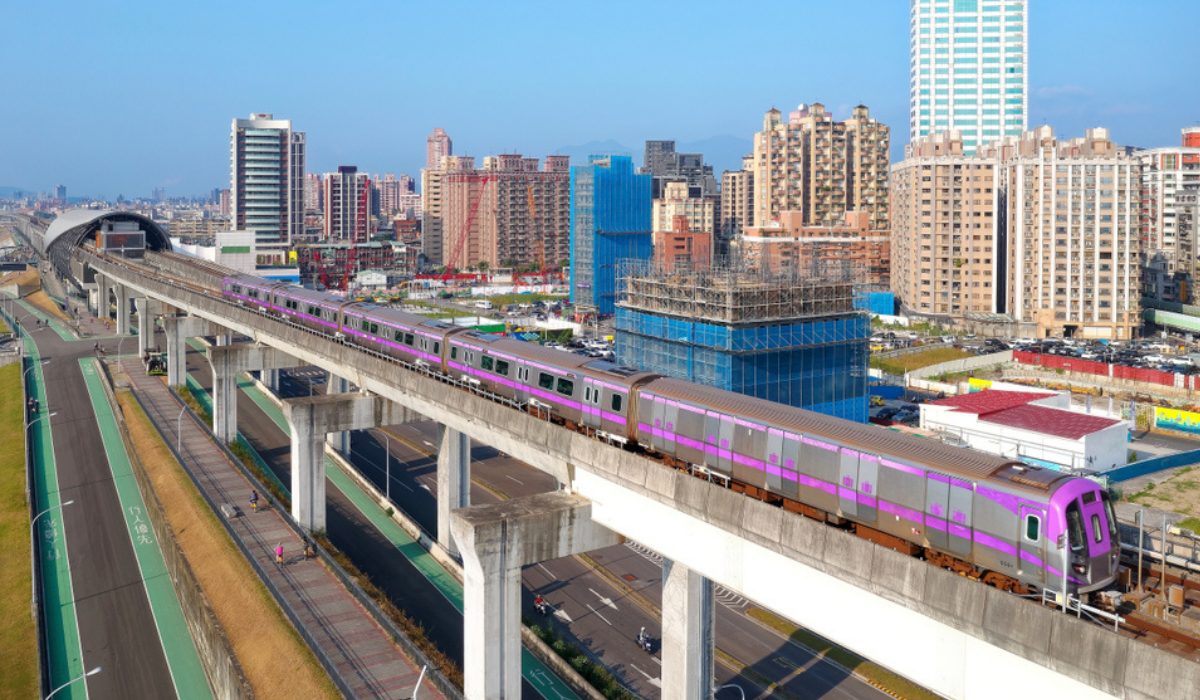
One of the 286 stations serving the Delhi Metro.
India’s government hopes to slash the time and money required to move goods from A to B not just by laying more asphalt, but also by boosting railways’ share of freight traffic, enhancing coastal ports’ connectivity with inland infrastructure, building multi-modal logistics parks designed to seamlessly transfer goods between trucks, trains, and warehouses, and deploying simple yet efficient IT systems that allow truckers to pre-book slots at border checkpoints rather than spend hours idling in queues. 
Satellite view of Rajasthan’s Bhadla Solar Park, the largest solar farm in the world.
As recently as a decade ago, power blackouts were a fairly common occurrence in India – as this frequent visitor to the subcontinent can personally attest. Outages are increasingly become a thing of the past, however, thanks to a doubling over the past decade of India’s electricity generation capacity, led by a more than five-fold expansion of wind and solar power. The government is pushing to double electricity generation once again before the end of this decade – mainly by adding more renewables – with the objective not only of limiting carbon emissions, but also of cutting power costs and energy-import bills. The simultaneous tailwinds of GST, India’s booming domestic e-commerce market, consolidation among third-party logistics providers, and the government’s infrastructure investment push are driving a boom in India’s logistics sector. Companies are rationalizing their fragmented pre-GST distribution footprints, replacing sub-scale pre-GST facilities with smaller numbers of larger, more centralized hubs. Global investors including Blackstone, Warburg Pincus, and Prologis (the world’s largest real estate investment trust) are competing to develop and acquire Indian logistics assets. This is transforming India’s warehousing industry into what one Mumbai banker calls a “full-blown supernova” of ambitious growth plans. The government’s stated aim is to slash the cost of domestic logistics from roughly 14% of GDP today to below 10% by the end of this decade. (For context, logistics costs in the United States account for approximately 8% of GDP.) Even a partial realization of that objective promises to further boost India’s attractiveness as a manufacturing hub – just as multinational companies’ diversification away from China gathers steam (see "Manufacturing and exports" section below). Digital India
India is also leveling up its infrastructure in the digital realm, delivering population-scale solutions that are bolstering financial inclusion, democratizing mobile payments, and facilitating greater convenience for hundreds of millions of people.
Since its debut in 2010, Aadhaar (which translates to “foundation” in Hindi) has grown into the world’s largest biometric ID system, with over 1.3 billion registrants and counting. Opening a bank account – previously a paper-intensive, weeks-long process – now takes seconds. Welfare and subsidy programs now disburse funds straight into the bank accounts of their hundreds of millions of beneficiaries – thereby bypassing corrupt officials and intermediaries who once siphoned off 40% or more of payments. Identify verification, once an in-person hassle (particularly for villagers lacking paper documents), is now a seamless process for everyone from rural-to-urban migrants looking to rent their first city apartment to middle-class mutual fund investors seeking to open a new brokerage account. 
Making a payment using a digital wallet scanner.
In 2016, India launched a national digital payment system known as the Unified Payments Interface (UPI). By facilitating the seamless and secure sharing of encrypted financial data among multiple services and accounts, UPI helped catalyze a thriving private-sector ecosystem of competing yet inter-operable digital wallets and mobile payment apps offered by banks, fintech startups, messaging platforms such as WhatsApp, and tech giants such as Amazon and Google. UPI has grown exponentially into the world’s largest real-time payment network, processing last year approximately 74 billion peer-to-peer (P2P) and person-to-merchant (P2M) transactions with a combined value of ₹126 trillion (≈$1.5 trillion). Aadhaar, UPI, and other state-sponsored digital services comprising India’s national “tech stack” have leveraged the country’s first-rate engineering talent, including by borrowing capable leaders from India’s world-class IT services industry. (The successful rollout of Aadhaar, for example, was led by Infosys co-founder Nandan Nilekani.) Their success has helped facilitate the emergence of the third-biggest startup scene globally after America’s and China’s, further boosted India’s already-booming e-commerce sector, and – most importantly – drastically increased the percentage of Indians with access to secure, efficient, and low-cost banking services. 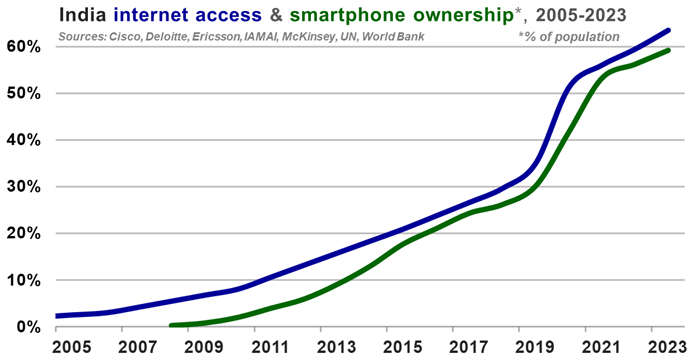
Digital technologies’ rapid adoption has gone hand-in-hand with accelerating expansion in the share of India’s population accessing the Internet – a trend driven principally by increasing smartphone ownership. Thanks in large part to Reliance Jio (a low-cost mobile operator that became India’s No. 1 wireless carrier within some three years of its 2016 launch), Indian consumers enjoy some of the world’s cheapest mobile broadband plans. Manufacturing and exports
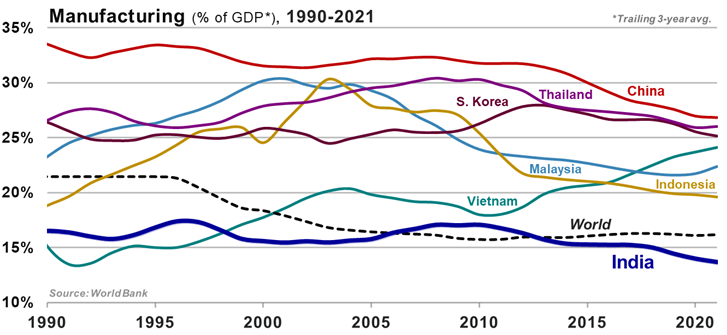
Manufacturing’s contribution to India’s GDP has for decades been stuck at or below 17% (as compared to at least 25% in China, South Korea, and Thailand). As detailed in the India’s unfinished revolution dispatch (particularly the “Labor” section), labor-intensive industry was historically stymied in India by overly rigid labor rules, inadequate infrastructure, and labor costs that until a decade ago were not substantially more competitive than in China.
Multinationals diversifying their supply chains away from China are increasingly turning to India. The term “China Plus One”, referring to business strategies aimed at diversifying away from China, was coined in 2013, and over the subsequent decade manufacturers trickled out of China as mainland factory wages doubled. Recently, however, the trickle has turned into a torrent as a result of geopolitical tensions and the damage inflicted by Beijing’s draconian Covid-19 policies on multinational companies’ confidence in China as a dependable manufacturing hub. Other countries in the region, such as Malaysia, Thailand, and Vietnam, are also beneficiaries of the shift out of China. India, however, offers an unrivaled combination of added attractions: abundant, inexpensive labor (with average manufacturing wages more than 70% below Chinese levels, and roughly 30%-70% below those in Mexico, Vietnam, Malaysia, Thailand, or Brazil); a vast, booming home market (with ample opportunities for both supplying incremental domestic demand and substituting for currently-imported products); existing clusters of globally-competitive firms in industries ranging from pharmaceuticals to electrical machinery; and a concerted effort by India’s government to incentivize the establishment of new factories and bolster exports of Indian-made goods. Indian manufacturers are increasingly seizing opportunities to develop and commercialize low-cost but high-quality products that, in many cases, displace imports from other countries. Examples from my recent meetings with Indian company managements include French defense avionics, Korean engineered plastics, and an array of Chinese-supplied goods, from active pharmaceutical ingredients to rubber additives. Launched in 2014, the government’s “Make in India” initiative serves as an umbrella term for various programs intended to boost manufacturing’s contribution to GDP and, in the process, facilitate large-scale job creation. These efforts include assistance with project land acquisition and licensing, as well as $26 billion in multi-year subsidies under a policy of “production-linked incentives” (PLI). Since 2020, PLI has offered firms investing in 14 designated industries incentives linked to their ability to set up new factories and grow output of everything from solar panels to electric batteries. Other related initiatives include a $10 billion incentive plan to attract semiconductor manufacturers, reforms liberalizing both central- and state-level labor laws, and a comprehensive easing of foreign direct investment (FDI) rules aimed at attracting increased foreign participation across more sectors of the economy. 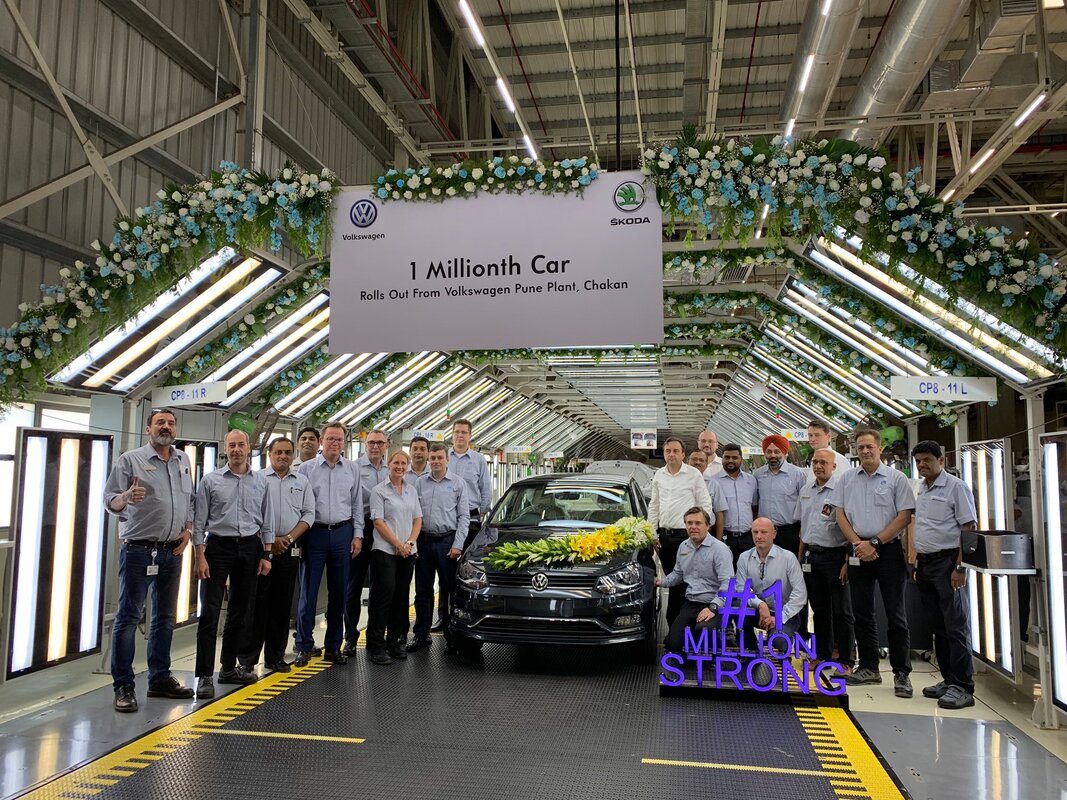
Volkswagen’s plant in Pune, Maharashtra celebrates its millionth car produced.
Other recent policy changes cheered by businesses include an overhauled bankruptcy code, a reinvigorated push to privatize state-owned enterprises (including, recently, flag carrier Air India), and a 2019 reduction in effective corporate tax rates from 35% to 25% for established companies, and as low as 17% for new manufacturing investments. Early evidence for the positive impact of this whirlwind of reforms can be seen in India’s climb up the World Bank’s Ease of Doing Business rankings, from 142nd in 2015 to 63rd just five years later.
“New bankruptcy laws. Financial system reforms. New efforts to have India’s banks address weaknesses in their balance sheets. And perhaps most importantly, the recently approved GST […each] of these represents an important step forward for India. Each sends a signal to the world’s investors […a] signal that India is focused on long-term growth and stability.” Multinational firms are investing heavily in Indian factories. In 2018, Samsung Electronics inaugurated the world’s largest mobile phone manufacturing facility in Noida, Uttar Pradesh. Apple (whose contract manufacturing partners have made iPhones in India since 2017) reportedly intends to quintuple India’s share of overall global iPhone production, from around 5% last year to 25% by 2025. Driven mainly by Apple and Samsung, India’s smartphone exports for the fiscal year ending March 31, 2023 are on track to roughly double from the prior year to more than $11 billion. 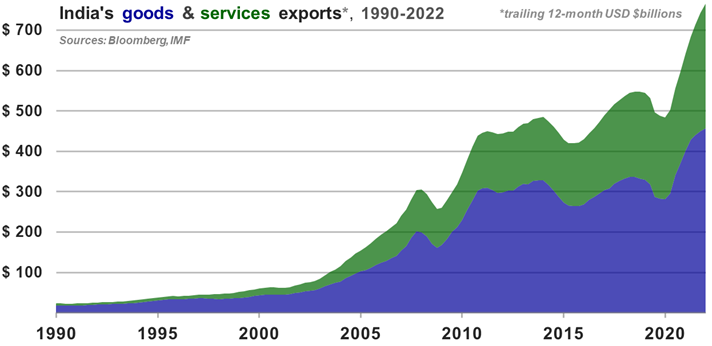
The manufacturing work shifting to India is increasingly high-tech. In late 2022, Indian conglomerate Vedanta and its technical partner Foxconn (the Taiwan-based company also known as Hon Hai Technology Group) announced plans to invest $19.5 billion into building new factories in Gujarat that will produce semiconductors and liquid-crystal displays (a.k.a. “LCDs” – used in smartphone and TV screens) and employ more than 100,000 people. Gujarat is reportedly also the planned site of a new $9 billion data storage device manufacturing facility to be built by U.S.-based Micron Technology. In February 2023, Ola (India’s leading rival to Uber) announced plans to invest nearly $1 billion into manufacturing capacity aimed at localizing critical elements of the electric vehicle supply chain. There has been a step change with respect to the number of Indian companies selling abroad and the scale of their ambitions. Examples of goods and services exported by companies whose managements I met just on my most recent (February 2023) trip to India include: active pharmaceutical ingredients; contract research and manufacturing services; corrosion-resistant process equipment used in chemical and pharmaceutical plants; extruded polystyrene used as energy-efficient insulation; high-performance pigments used in automotive coatings and cosmetics; flavoring agents used in food and beverages; and surfactant additives used in shampoos and detergents. 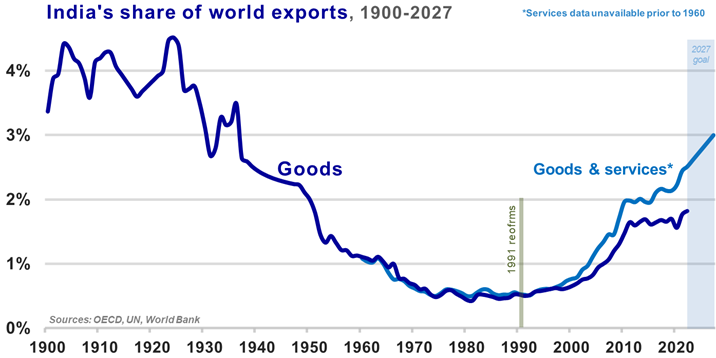
India’s ability to attract higher-tech goods production is rooted in its world-class IT services and business process outsourcing industries, which in 2022 drove a nearly 30% year-on-year increase in the country’s services exports, to an all-time high of more than $300 billion. In the 2022 calendar year, India’s goods exports exceeded $450 billion – up by 15% from the prior year and by nearly 40% from their pre-pandemic peak level, led by significant growth in shipments to the U.S. and European markets. According to a recent Bain & Company report, Indian manufacturing exports are expected to reach $1 trillion within the next five years, driven by the chemical, pharmaceutical, industrial machinery, electrical/electronics, and automotive sectors. The long-term growth opportunity remains enormous, with India still accounting for less than 2% of global goods exports. The government’s stated aim is to raise Indian exports’ global share to 3% by 2027 and to 10% by 2047, when India will celebrate the centennial of its independence. The Indian Century
The vast majority of Indians alive today have grown up in the aftermath of their country’s 1991 economic liberalization (detailed in the India before 1991 and India since 1991 dispatches). This post-1991 majority is coming of age in a country being transformed by booming infrastructure investment, deepening integration into global supply chains, smartphone app-enabled technological innovation (facilitated by some of the world’s cheapest mobile data plans), and growing societal acceptance of risk-taking and entrepreneurship. They have witnessed the dramatic effects of economic growth, which just in the past 15 years has lifted 415 million Indians out of poverty (according to the UN’s definition of the term), driving the nation’s poverty rate down from 55% to approximately 16%.
Once food insecure, India is now a net exporter of food grains, and is the world’s largest exporter of rice. The country’s pharmaceutical industry makes a leading 20% share of the world’s generic medicines. Indian companies produce 60% of the world’s vaccines, and played an indispensable global role in delivering enough Covid-19 vaccine doses to mitigate the pandemic’s impact. Pune-based Bharat Forge is the globe’s top supplier of metal forgings. Mumbai-based Reliance Jio operates the planet’s largest 5G wireless network. Mumbai-based Reliance Industries’ oil refining complex in Jamnagar, Gujarat is the world’s largest, as is Mumbai-based JSW Steel’s plant in Bellary, Karnataka. Five-year broadcast rights for India’s top cricket competition, the Indian Premier League (IPL), recently sold for $6.2 billion – establishing the IPL as one of the world’s most valuable sports leagues – and second only to the NFL on a per-match basis. 
An enthusiastic crowd at the grand opening of a Hyderabad shopping mall.
Today’s rising generation rightly conceives of India as a proud nation that plays an increasingly critical role in global affairs. Two-way ties have never been deeper between India and the United States – the world’s two largest democracies. Recently-announced India-U.S. partnerships in areas including defense technology, semiconductors, and advanced telecommunications are fostering tighter connections between the two countries’ governments, private sector firms, and universities. Indian companies employ 125,000 Americans. Reciprocally, IBM employs more workers in India than in the U.S., while Goldman Sachs’ 9,000 Indian staff represent that firm’s second-largest presence globally. The list of major U.S. corporations headed by Indian-born CEOs includes Adobe, Google, FedEx, IBM, Microsoft, and Starbucks. Mastercard’s Indian-American former CEO, Ajay Banga, was recently nominated to be president of the World Bank. The ranks of U.S. businesses with India at the center of their growth plans grows longer by the day. Two prominent examples include Walmart, where executives expect India to surpass China this year as the company’s largest international market, and Amazon, which Jeff Bezos believes will make India its biggest market after the U.S. “within a decade”. Another, denim retailer Levi’s, just last week opened a new flagship store in Bengaluru – now its largest retail location in all of Asia – to be followed later this month by the launch in Mumbai of India’s first “official” (i.e., company-owned) brick-and-mortar Apple store. India is also strengthening ties with fellow democracies from the Pacific to Europe. The leaders of the so-called “Quad” grouping of Australia, India, Japan, and the U.S. now regularly host each other at top-level summits, and recently organized their navies’ third consecutive joint live-fire exercises. During a recent visit to New Delhi, Japan’s prime minister cheered rapidly growing economic ties with India, citing rapid progress on the Japanese-designed Mumbai-Ahmedabad high-speed rail project (discussed above) and pledging ¥5 trillion (≈$38 billion) in public and private Japanese investment in India over the next five years. Over in Europe, meanwhile, Indian companies employ 110,000 people in Britain alone, while Indian-born CEOs run corporate giants including Barclays, Chanel, Diageo, and Novartis. And to top it all off, the U.K.’s latest prime minister is a third-generation British-Indian. 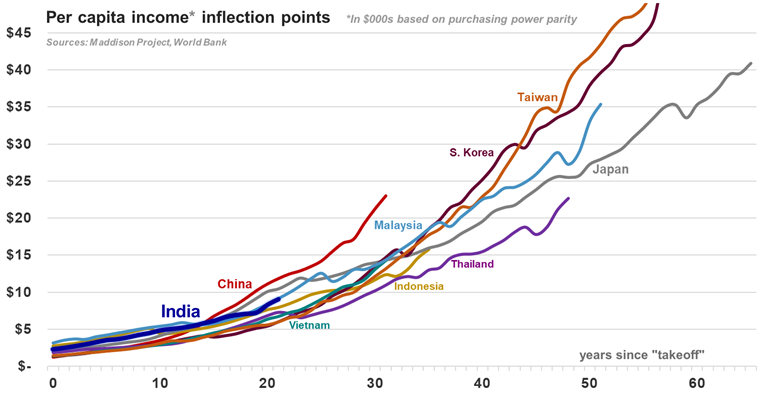
On a purchasing power parity (a.k.a. “PPP” – defined in the appendix) basis, India’s current average income is roughly comparable to that of 2010 China, 2003 Thailand, 1991 South Korea, or 1968 Japan. In each of those countries, this level of PPP per capita GDP marked an inflection point heralding a decade or more of accelerated growth in investment, consumer spending, and overall living standards. India is well-placed to seize this moment thanks to its unmatched combination of exceptionally favorable demographics, ongoing growth-enhancing urbanization, and an abundance not only of cost-competitive low-skilled labor but also of graduates with engineering and other technical skills – not to mention more than one hundred million self-identified English speakers (representing the world’s largest English-speaking population after the United States). Continued demographic and economic growth is set to give India the world’s largest labor force within the next couple years, and to make it the globe’s third-largest consumer market by 2030. Most momentously, India has the potential to displace the U.S. and/or China as the world’s largest economy within this century. Such an outcome would actually be a return to the historical norm for India, whose current 3% share of global GDP – while up threefold over the past 30 years – has much more room to catch up before matching the 24% share of world GDP that India accounted for as recently as 1700. * * * Andrei Stetsenko April 6, 2023 Appendix: purchasing power parity
Economists use purchasing power parity (PPP) to try to eliminate the differences in price levels between countries. Analyses that fail to account for these price differences – which tend to be particularly significant with respect to nontraded, labor-intensive services such as haircuts and taxi rides – will underestimate the purchasing power of consumers in relatively low-wage economies such as India.
A purchasing power parity (a.k.a. “PPP conversion factor”) is the ratio of the cost, in local currency units, of a basket of goods and services in any given country divided by the cost, in U.S. dollars, of the same basket in the United States. Put another way, a purchasing power parity is the theoretical exchange rate at which the currency of each country would have to be converted into U.S. dollars to buy identical baskets of goods and services in each country. The IMF estimates India’s purchasing power parity at around 24 Indian rupees per U.S. dollar – equivalent to roughly one-third of the current market exchange rate of 82 rupees per dollar. Dividing India’s local-currency GDP (currently approximately 300 trillion rupees) by 24 gives us India’s estimated PPP GDP of roughly $12.5 trillion. Dividing that same local-currency GDP by 82 gives us India’s market-rate GDP of roughly $3.7 trillion. Legal information and disclosures
The views expressed are the views of the author as of the date indicated on each posting; such views are subject to change without notice. Farley Capital L.P. (Farley Capital) has no duty or obligation to update the information contained herein. Further, Farley Capital makes no representation, and it should not be assumed, that past investment performance is an indication of future results. Any discussion regarding investment returns or financial projections are provided as illustrative examples only and no inference shall be made therefrom regarding the potential for returns on any investment discussed. Moreover, you should be aware that all types of investments involve a significant degree of risk, and wherever there is potential for profit, there is also the possibility of loss.
This content is being made available for informational and educational purposes only and should not be used for any other purpose. The information contained herein does not constitute and should not be construed as financial, legal, or tax advice, or as an offering of advisory services. The information contained herein shall not constitute an offer to sell, or a solicitation to subscribe for, interests in any investment vehicle managed by Farley Capital, which offer or solicitation will only be made to qualified investors and accompanied by a private placement memorandum, subscription agreement, and other related offering documents. Certain information contained herein concerning economic trends and performance is based on or derived from information provided by independent third-party sources. Farley Capital believes that the sources from which such information has been obtained are reliable; however, it cannot guarantee the accuracy or completeness of such information and has not independently verified the accuracy or completeness of such information or the assumptions on which such information is based. This content, including the information contained herein, may not be copied, reproduced, republished, or posted in whole or in part, in any form without the prior written consent of Farley Capital. References and notes
PDF version of this post
India has historically been able to maintain enviable rates of GDP growth even during global downturns, aided by factors including durable demographic tailwinds and the drops in oil import costs that often coincide with such slowdowns. 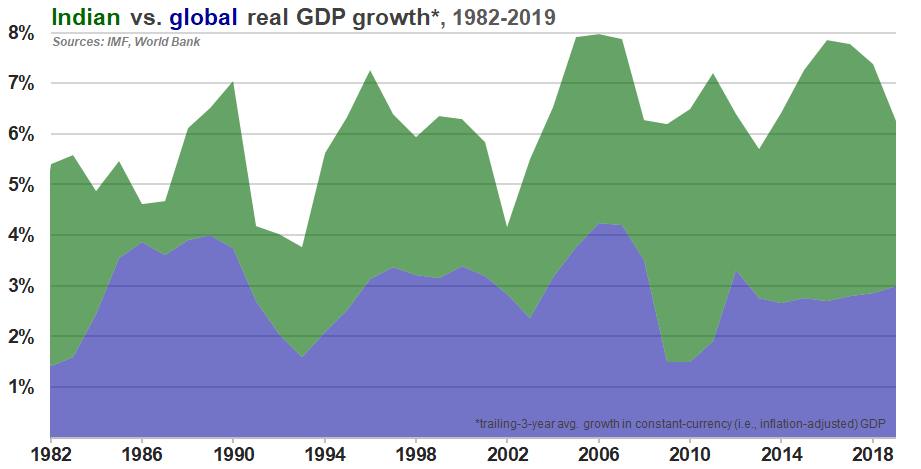 The world’s third-largest oil importer (behind China and the U.S.), India is an unambiguous beneficiary of lower oil prices. With limited domestic production, India relies on imports for more than 80% of its petroleum demand. The country’s 2019 crude oil import bill exceeded $120 billion – equivalent to over 4% of GDP and accounting for more than four-fifths of its overall merchandise trade deficit. Historically, significant declines in oil prices have for India been leading indicators of faster GDP growth, lower inflation, smaller current account deficits, and reduced fiscal deficits. 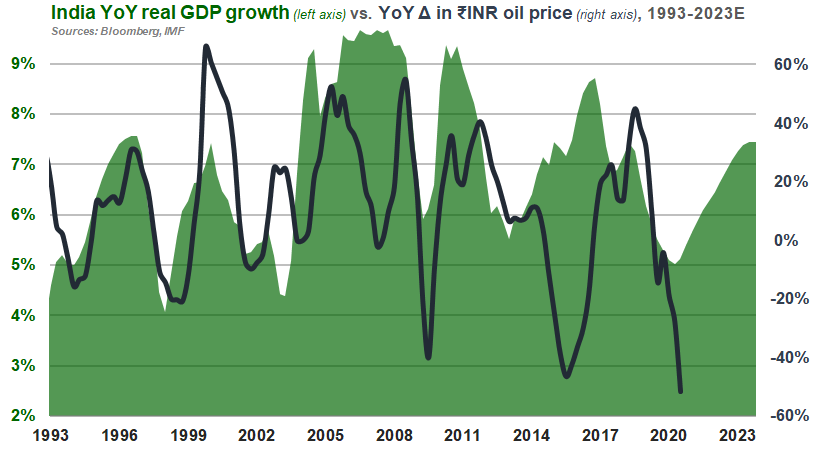 I recently sat down with Real Vision to discuss India's demographic dividend, rapid urbanization, and investing landscape.
The pace of Indian consumer price inflation is hovering just above a two-decade low, driven by the combination of subdued commodity prices and relatively disciplined fiscal policy. Even as India's GDP continues to grow at the fastest pace of any major economy, muted inflationary pressures have cleared the way for two successive interest rate cuts by the central bank in recent months. 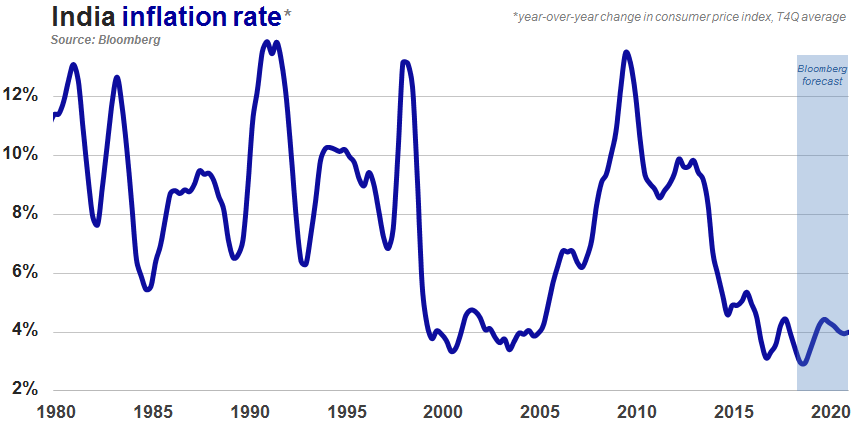 More to come on this topic in an upcoming dispatch. Click here to return to the homepage.
|
|||